API Summary
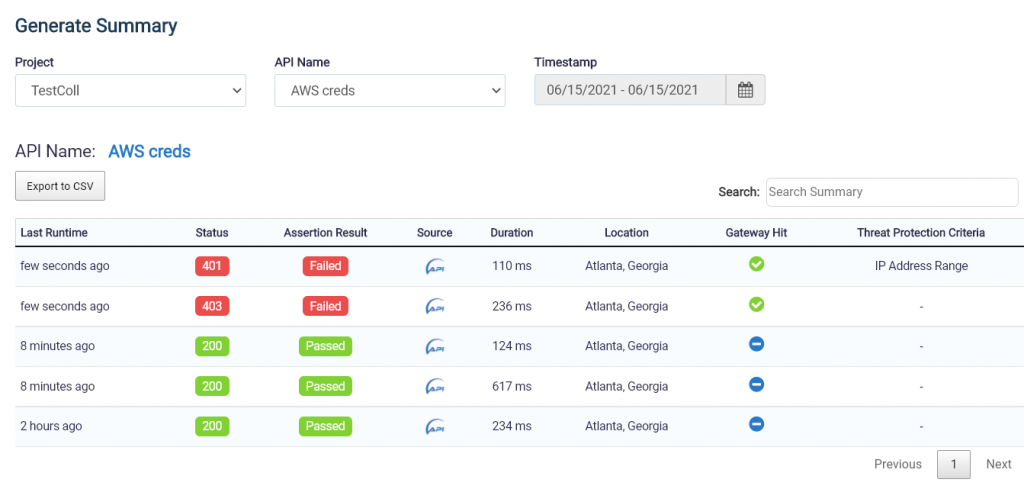
APIStrong provides a report section for your API analysis. For API summary, select API Summary under the Report tab of the top navigation.
On the Report Summary screen, select Project, API name, and timestamp. API summary of selected API will appear on the screen.
API Usage
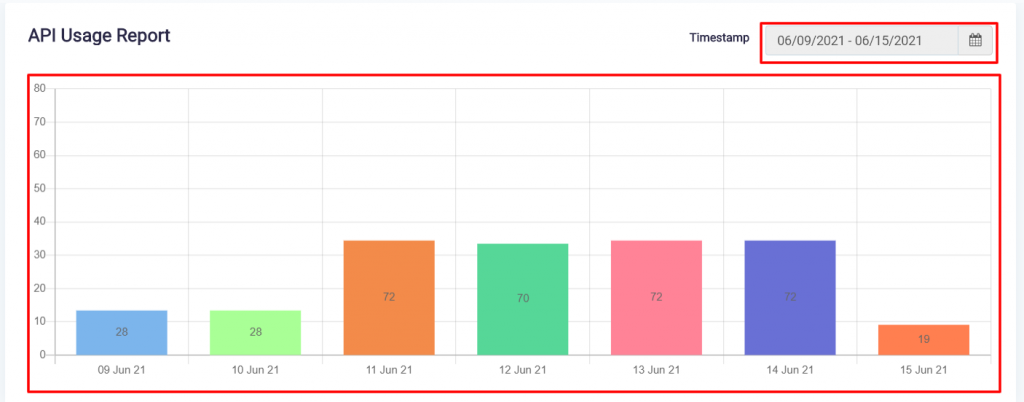
Click on API Usage under Reports.
Get day-wise API usage here. Select Timestamp of which you want to check API usage.
Audit Log
Click on Audit Log under Reports.
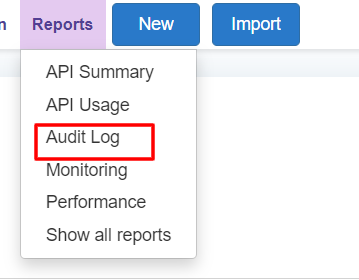
Check activities of users from audit logs.
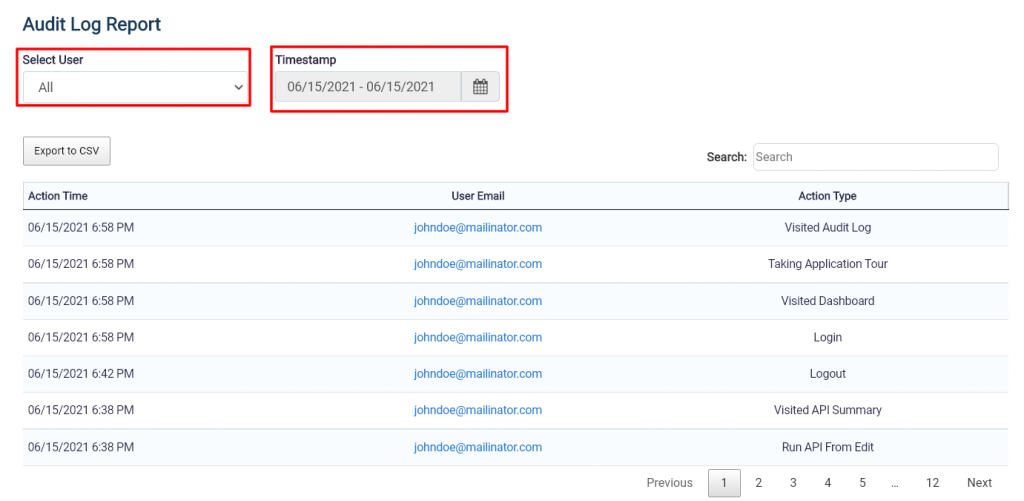
Select user from dropdown whose activities you want to see. Admin can see the activities of all users. Select timestamp, if activities of the specific period you want to monitor.
Performance Report
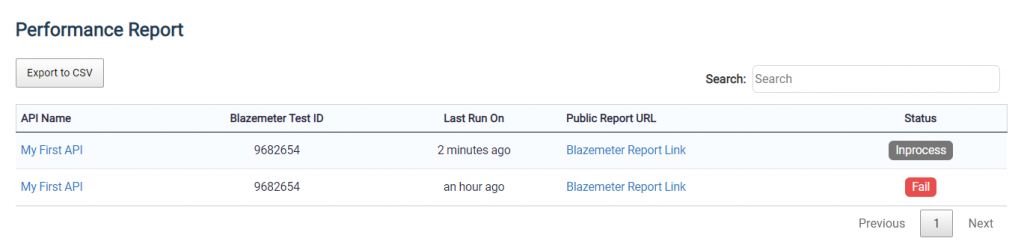
Get Blazemeter Test reports here, which are created from APIStong. For the Performance screen, Navigate to the Performace option from the Reports menu.
Get test result, Blazemeter ID, and report URL here. Test which are running has the status Inprocess. On test completion, the result will be pass or fail.
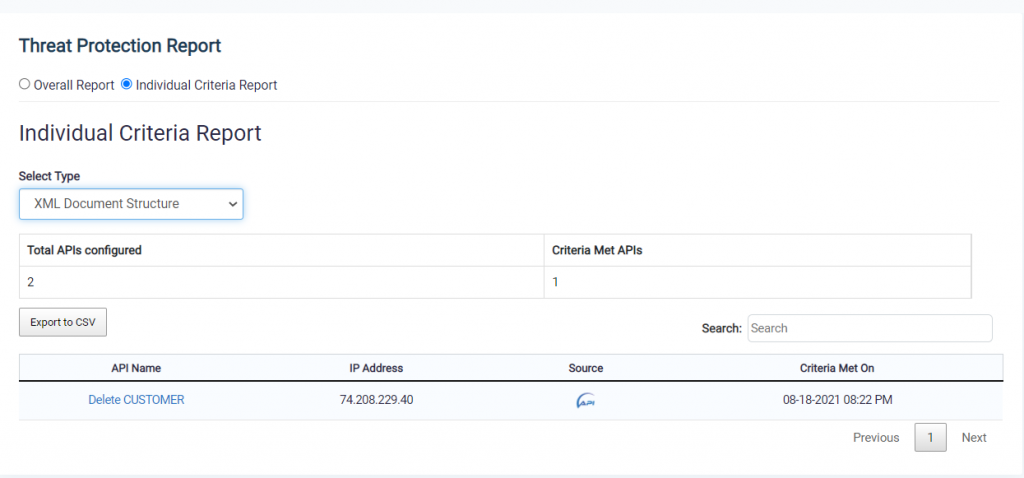
Threat Protection Report
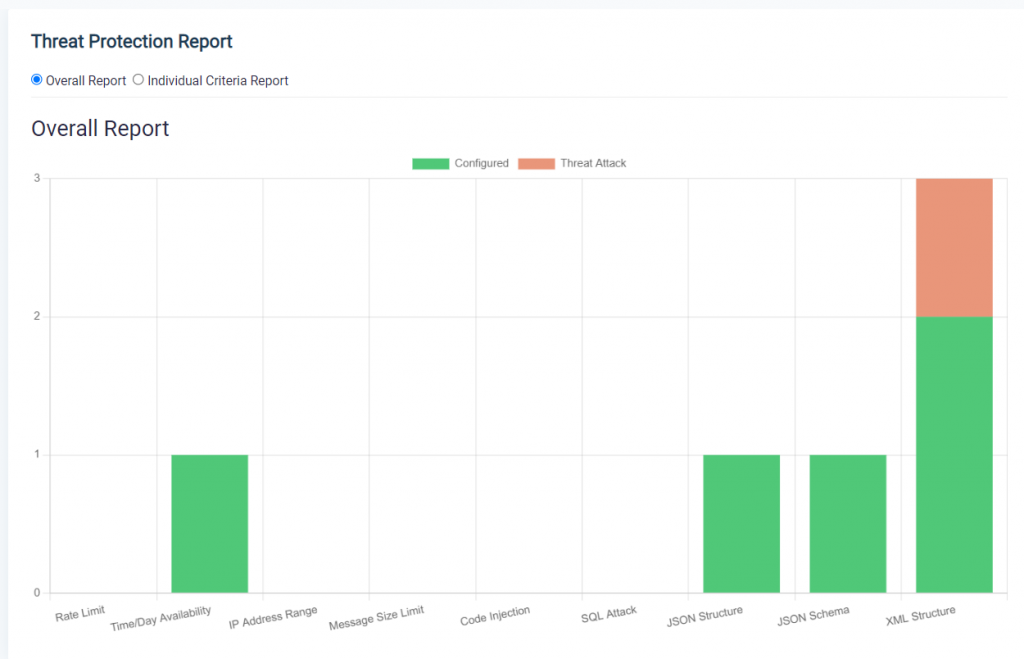
Get a Threat protection report on criteria defined and criteria met. For the screen, Navigate to the Threat Protection option from the Reports menu.
Get overview report across all threat protection types and details report for each API on criteria met on click of the graph.
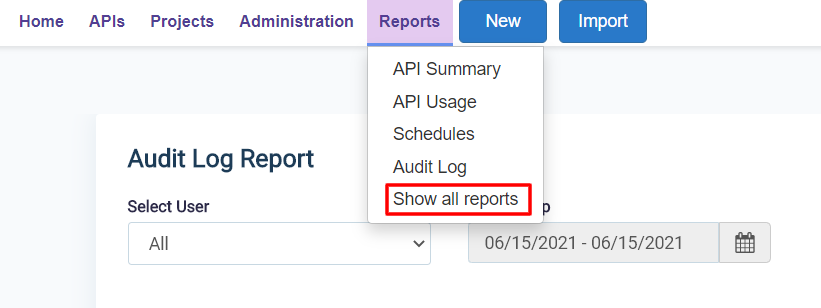
Detailed Report
For a detailed API report, select Show all reports under the Report tab of the top navigation.
On the report screen, select API name or workflow name from the sidebar. Details of selected API/workflow are visible on the right side.
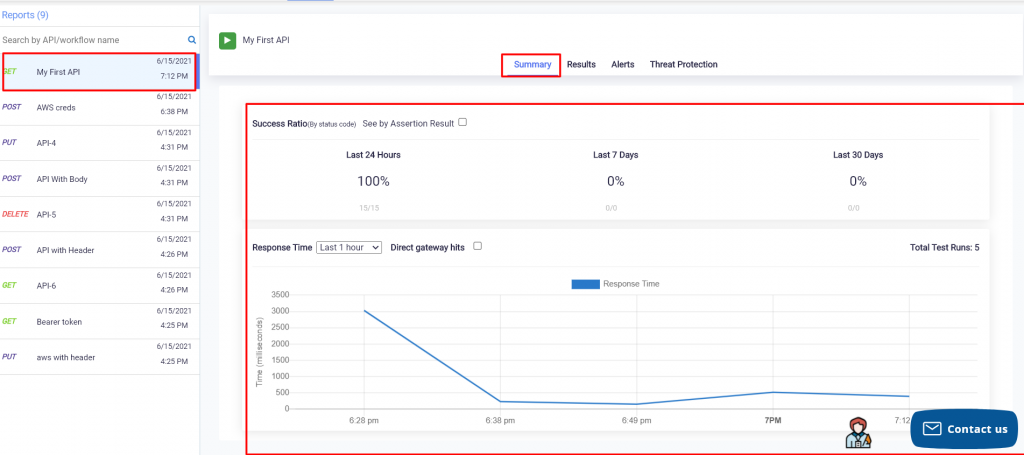
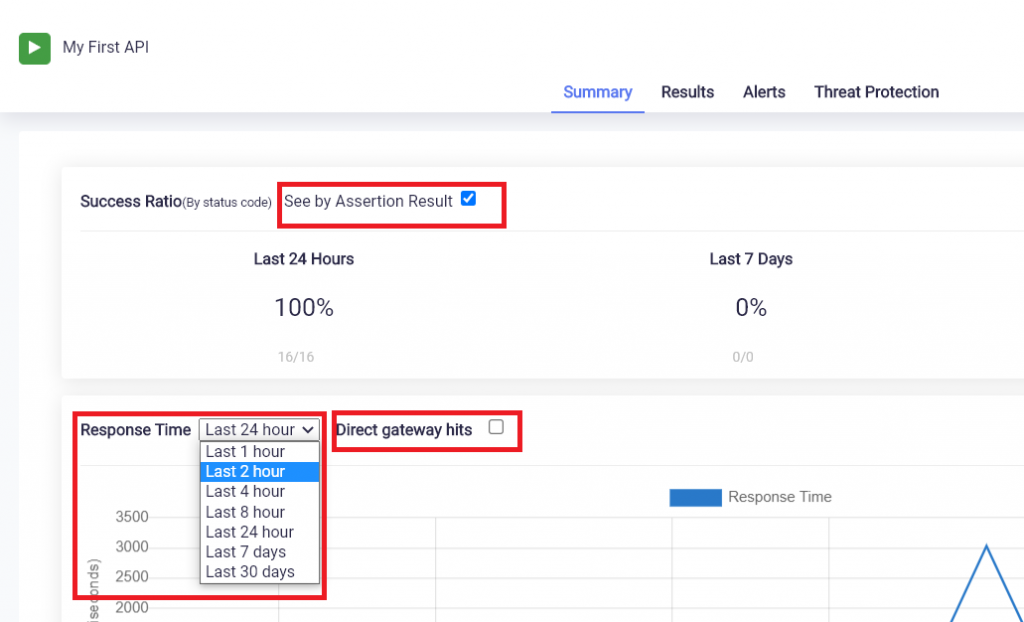
On a detailed report, in the first tab, you will see a Summary. In summary, success ratios of the last 24 hrs, last 7 days, and last 30 days are given. In the bottom part, you will get a response time graph. You can select timestamps and get a specified period graph. On check on Only gateways hits checkbox, response time graph of gateways hits will be visible. Select See by Assertion Result checkbox if you want to check the result of assertion.
In the Result tab, you can see the last 100 API runs. API runs can be filtered with right side filters All, Pass, Fail, and Gateway hits.
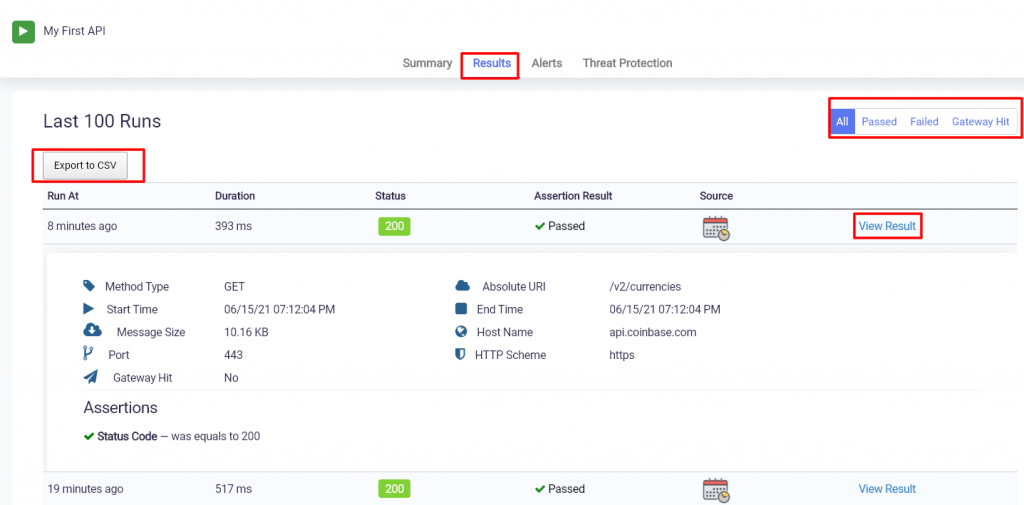
Use the Export to CSV button to export results in CSV. Click on View Result to check API result details.
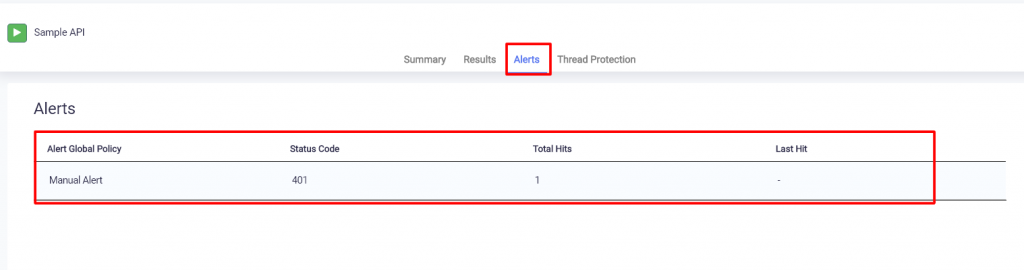
In the Alerts tab, you can see a list of alters that you have set for API.
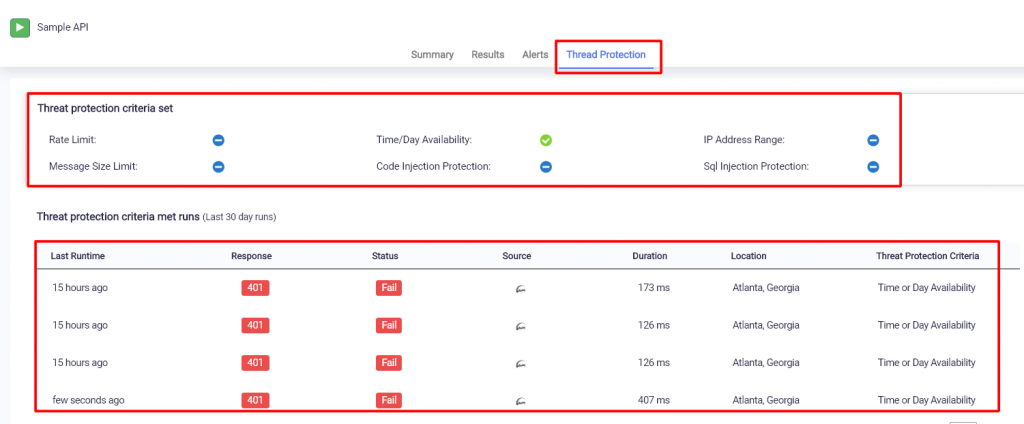
In the Threat Protection tab, you will get what threat protection criteria you have set for API and a list of runs where criteria have been met.
Under left navigate you can select workflow name to check detailed workflow report.
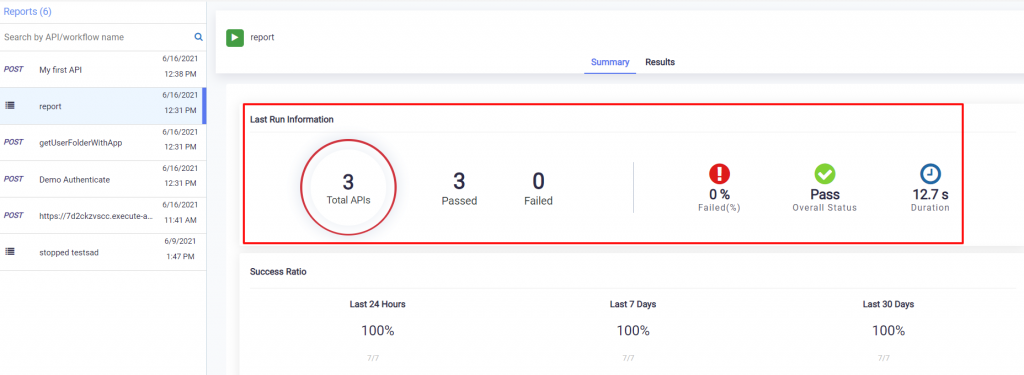
In summary, the last workflow run information given. You can check how many APIs from workflow passed/failed, overall workflow status, error percentage, and workflow execution duration.
In Success Ratio, success percent of last 24 hours, 7 days, and 30 days are given.
Click on the Results tab to get workflow history.
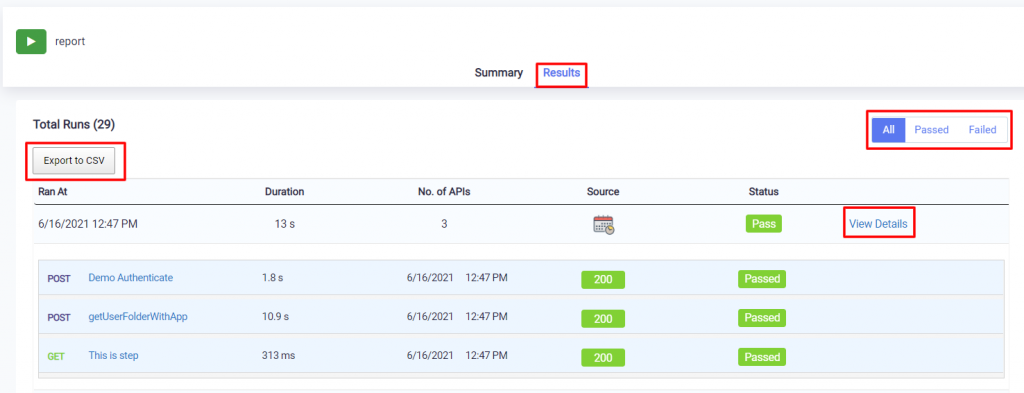
Use left All/Pass/Fail filter to filter result APIs. Click on the View Details link to see how many APIs workflow had and what’s their execution status in the workflow.
Export to CSV button can be used to export workflow result into CSV file.